Reducing our emissions and improving energy efficiency
We reduce greenhouse gas emissions according to our science-based targets, prefer energy from zero-CO2 sources, and continuously improve the energy efficiency of our factories.

Emissions
We're proud to show leadership in addressing climate change. The latest example is our new factory in Romania, which is the first full-scale zero-CO2-emissions (Scope 1 & 2) factory in the tire industy.
Our Climate Transition Plan was published in 2026, and it is available here.
Besides greenhouse gas emissions, there are also VOC emissions, particle emissions, emissions from energy production, odor and noise.
Greenhouse gas emissions
We reduce greenhouse gas emissions in line with our science-based targets that have been validated by the Science Based Targets initiative. We calculate our tire production’s greenhouse gas (GHG) emissions from raw material purchasing to the disposal of the product in compliance with the GHG protocol. We generate part of the energy needed in our own power stations, excluding the factory in Finland. Therefore, the Finnish factory’s direct GHG emissions are lower than those of the factory in the US.
| Retrospective | Milestones and target years | ||||||||
| Base year | 2024 | 2025 | % 2025 / 2024 | 2025 | 2030 | 2050 | Annual % target / Base year2 | ||
| Scope 1 GHG emissions | 2022 | ||||||||
| Gross Scope 1 GHG emissions (tCO2eq) | 10,494 | 14,702 | 14,896 | 101% | 12,000 | 14,000 | 2,000 | -4.2% | |
| Percentage of Scope 1 GHG emissions from regulated emission trading schemes (%) | 0 | 0 | |||||||
| Scope 2 GHG emissions | 2022 | ||||||||
| Gross location-based Scope 2 GHG emissions (tCO2eq) | 25,845 | 23,389 | 32,183 | 138% | |||||
| Gross market-based Scope 2 GHG emissions (tCO2eq) | 21,186 | 6,940 | 4,659 | 67% | 15,250 | 4,360 | 1,160 | 9.9% | |
| Scope 1 + Scope 2 (market-based) emissions | 31,680 | 21,642 | 19,555 | 90% | 27,250 | 18,360 | 3,160 | 5.3% | |
| Significant scope 3 GHG emissions | 2022 | ||||||||
| Total Gross indirect (Scope 3) GHG emissions (tCO2eq) | 7,151,790 | 7,642,986 | 7,935,043 | 104% | |||||
| 1 Purchased goods and services | 589,545 | 647,242 | 682,506 | 105% | 409,924 | 507,003 | 81,575 | 1.8% | |
| 2 Capital goods | 54,206 | 135,476 | 55,994 | 41% | 49,704 | 89,233 | 7,405 | -8.1% | |
| 3 Fuel and energy-related activities (not included in Scope 1 or Scope 2) | 13,925 | 16,321 | 17,453 | 107% | |||||
| 4 Upstream transportation and distribution | 53,124 | 57,603 | 72,538 | 126% | 44,202 | 58,565 | 7,257 | -1.3 % | |
| 5 Waste generated in operations | 280 | 267 | 332 | 125% | |||||
| 7 Employee commuting1 | 1,059 | 1,368 | 1,985 | 145% | |||||
| 8 Upstream leased assets | 12,708 | 8,323 | 8,171 | 98% | |||||
| 9 Downstream transportation | 446 | 241 | 266 | 110% | |||||
| 11 Use of sold products | 6,422 428 | 6,770 121 | 7,089,665 | 105% | |||||
| 12 End-of-life treatment of sold products | 4,070 | 6,025 | 6,133 | 102% | |||||
| Total GHG emissions | |||||||||
| Total GHG emissions (location-based) (tCO2eq) | 7,188,129 | 7,681,077 | 7,982,122 | 104% | |||||
| Total GHG emissions (market-based) (tCO2eq) | 7,183,470 | 7,664,628 | 7,954,598 | 104% | |||||
1: Includes the tire factories.
2: 2030 target used in calculation.
New technology benefits the society
Our zero-CO2-emissions (Scope 1 & 2) factory in Romania started tire deliveries in 2025. Benefits to society of the avoided CO2 emissions are estimated at 76,200 euros per one million tires manufactured there. The estimation is based on the following figures:
- The average weight of a passenger car tire is 10 kg
- In 2025, the CO2e emissions (Scope 1 and 2) intensity of our tire factories in Finland and US was 127 kg CO2e per ton of tires produced
- The social cost of carbon is estimated at €60 per ton of CO2e emissions.
Internal carbon pricing
Nokian Tyres introduced internal carbon pricing (ICP) for CO2 emissions reduction in 2022. The internal carbon pricing is integrated into the investment process as a shadow price, and it takes into account the impact of carbon as a factor in investment decisions regarding energy-intensive investments. Thus it can be considered to promote the transition toward carbon neutrality by driving energy efficiency and low-carbon investments and by incentivizing consideration of climate-related issues in decision making.
The price of CO2 is currently set at 50 euros per tonne, and it is typically applied to Scope 1 and 2 but can also be applied to Scope 3.
Get to know our guidelines for GHG emissions base year adjustments
Volatile organic compounds (VOC)
Solvents, or volatile organic compounds (VOCs), are among Nokian Tyres’ most significant air emissions. Since VOC regulations are country-specific, the calculation and reporting of VOC emissions vary by location.
In Finland, VOC emissions are calculated according to the EU’s VOC directive, and the calculation is based on the used solvents. Nokian Tyres’ ongoing air pollution target at its Finnish tire factory is to fulfill the requirements of the environmental permit. The target is mandatory, as the emissions of volatile organic compounds from the exhaust gases after the incineration plant may not exceed 20 mg C / m3 according to the Finnish factory’s environmental permit, which was renewed in 2025.
VOCs come from heavy tire assembly at the Finnish factory, and they are collected and processed at a catalytic incineration plant. However, capturing all solvent emissions from heavy tire production remains challenging because the sources cannot be completely sealed to ensure full collection and incineration. In 2025, the volume of VOC emissions was 1.5 mg C / m3 (1.5 in 2024) after the incinerator in the tire factory in Finland. Thus, the VOC-related goal was achieved.
In the US, VOC emissions are calculated in accordance with local legislation and the State-issued minor source air permit. The calculation is based on established emissions factors and the quantity of raw materials processed. There is no specific facilitywide VOC limit; rather, limits are set for individual processes within the facility. Nokian Tyres targets to stay below the permit limits. In 2024, Nokian Tyres discovered that all VOCs were not accounted for in the established emissions factors and self-reported this error to the authorities. Recalculations showed that because of this error, the air permit limit had been exceeded since 2021, and in spring 2025, the company received a penalty of $5,700 for the violation. Nokian Tyres applied for an updated minor source air permit of the US factory and received it in the fall. In 2025, VOC emissions from the US factory were 37.5 tons, remaining under the permit limit.
Particle emissions (dust)
Particle emissions are caused by the processing of powdery chemicals in our compound mixing department. The mixing equipment is fitted with effective ventilation and dustcollection devices, and the best separation rates achieved by water cleaners exceed 99 percent. We measure particle emissions with particle concentration and differential pressure gauges. In addition, outside experts carry out regular concentration measurements.
The measured particle concentrations have complied with the permit limits at our factories. The dust that passes through the filter system mainly causes an aesthetic inconvenience and poses no harm to the environment or health.
Emissions from energy production
An independent company measures the nitrogen and sulfur emissions from our own energy production plants. Our nitrogen and sulfur emissions are below the set emission limits.
You can see our NOx and SOx emissions in our Sustainability Statement.
Odor
According to surveys that we have commissioned, odor emissions are momentary. The mastication process for softening natural rubber causes discharges of compounds during the precipitation and dehydration phases of rubber milk that results in an unpleasant odor in the near surroundings. We use droplet separators for reducing the odors from mastication. We have also managed to lower the number of separate mastication processes, thereby reducing the related odors.
Our factories have introduced new odor control equipment that represents the best available technology (BAT). We have also managed to lower the number of separate mastication processes, thereby reducing the related odors.
Some odors are generated during the tire curing process. The quantity of the curing fumes released in the process is directly proportional to the amount of cured rubber. The concentrations of individual substances in the fumes are very small.
Noise
Our production facilities have noise limits subject to their environmental permits. We regularly track and measure noise emissions. According to the measurements, we are below the noise limits.
Energy
The energy we use can be divided into electricity, heat and steam. We purchase energy for our factories from external suppliers. We generate some of the electricity and steam ourselves. In 2025, 80.5 percent of all energy used in our tire factories was produced from renewable energy sources.
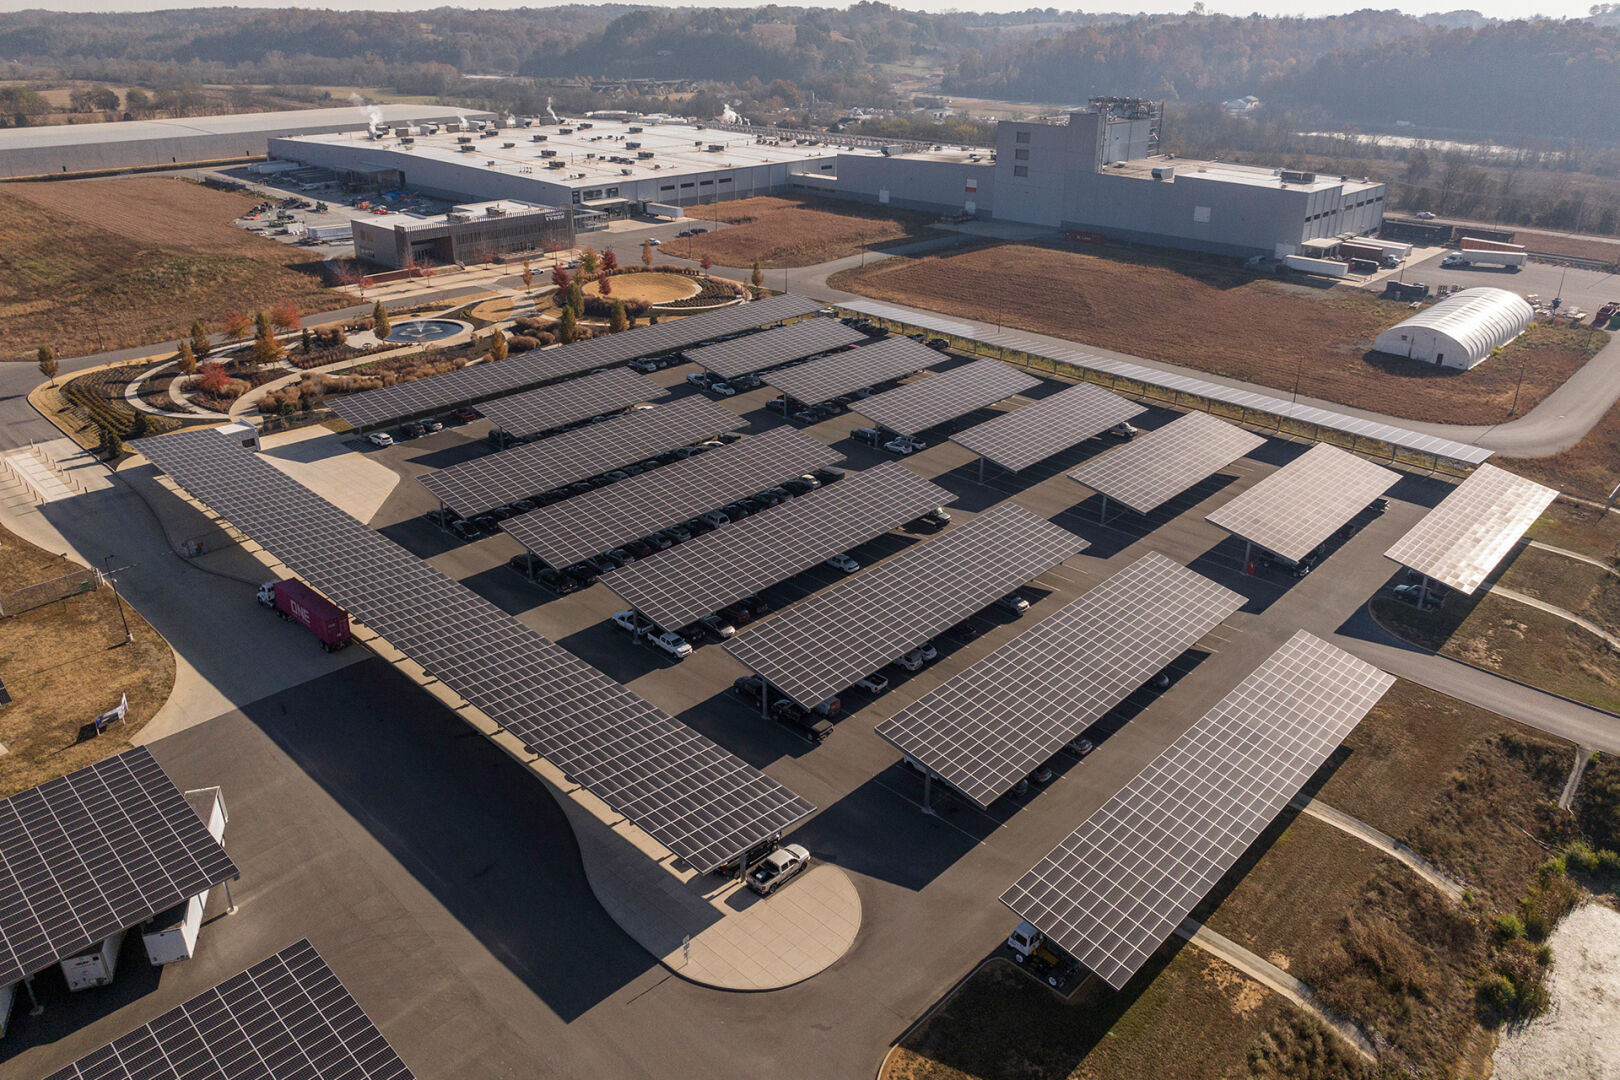
Steam is generated in the nearby biomass power plant. Energy is provided by solar panels to our administration building in the US factory and to the Visitor Center building in the Nokian Tyres Spain test center, for example.
Improving energy efficiency
Nokian Tyres improves energy efficiency, targeting for 2.75 kWh / product kilogram by 2030. This requires continuous work to identify the causes of excess energy consumption, defining improvement actions, and monitoring progress. The energy efficiency working group meets regularly to lead the work.
To monitor progress, the energy consumption of the factories is followed monthly and reported to the company management. The energy consumption of the rest of our locations is monitored quarterly.
We have invested in actions small and big – from replacing lighting with LED light bulbs to having energy efficiency as a criterion when procuring new machinery for the tire factories – and will do so also in the future. Energy audits for a large enterprise are conducted every four years, with the latest one conducted in 2023. The Finnish factory is committed to a voluntary energy efficiency contract.
We’re currently studying the requirements of the ISO50001 energy management system, with the intention of building our system during 2025 and 2026 and having it certified.
Training our employees
Promoting general awareness among employees is a key factor in daily energy efficiency improvements. The topic is present in the Sustainability eLearning course that is part of the induction of new employees, and Nokian Tyres has participated in energy efficiency campaigns and theme weeks organized by third parties, communicating the topic to employees with practical tips.
| Energy consumption and mix | 2025 | 2024 | Tire factory, Finland 2025 | Tire factory, Romania 2025 | Tire factory, US 2025 | Wheel factory, Finland 2025 | Other 2025 |
| (1) Fuel consumption from coal and coal products (MWh) | - | - | - | - | - | - | - |
| (2) Fuel consumption from crude oil and petroleum products (MWh) | 3,809 | 4,483 | 0 | 0 | 0 | 22 | 3,787 |
| (3) Fuel consumption from natural gas (MWh) | 71,296 | 71,140 | 0 | 0 | 66,376 | 4,064 | 856 |
| (4) Fuel consumption from other fossil sources (MWh) | - | - | - | - | - | - | - |
| (5) Consumption of purchased or acquired electricity, heat, steam, and cooling from fossil sources (MWh) | 27,302 | 37,974 | 3,880 | 0 | 0 | 1,407 | 22,015 |
| (6) Total fossil energy consumption (MWh) (calculated as the sum of lines 1 to 5) | 102,407 | 113,596 | 3,880 | 0 | 66,376 | 5,493 | 26,658 |
| Share of fossil sources in total energy consumption (%) | 23.6 | 29.9 | 1,9 | 0 | 60.4 | 53.5 | 41.8 |
| (7) Consumption from nuclear sources (MWh) | 10,004 | 55,280 | 0 | 0 | 0 | 4,784 | 5,221 |
| Share of consumption from nuclear sources in total energy consumption (%) | 2.3 | 14.5% | 0 | 0 | 0 | 46.5 | 8.2 |
| (8) Fuel consumption for renewable sources, including biomass (also comprising industrial and municipal waste of biologic origin, biogas, renewable hydrogen, etc.) (MWh) | 359 | 338 | 0 | 0 | 0 | 0 | 359 |
| (9) Consumption of purchased or acquired electricity, heat, steam, and cooling from renewable sources (MWh) | 317,658 | 207,534 | 198,570 | 47,063 | 40,535 | 0 | 31,490 |
| (10) The consumption of self-generated non-fuel renewable energy (MWh) | 3,003 | 3,217 | 0 | 0 | 3,003 | 0 | 0 |
| (11) Total renewable energy consumption (MWh) (calculated as the sum of lines 8 to 10) | 321,020 | 211,089 | 198,570 | 47,063 | 43,538 | 0 | 31,849 |
| Share of renewable sources in total energy consumption (%) | 74.1 | 55.6 | 98.1 | 100 | 39.6 | 0 | 50 |
| Total energy consumption (MWh) (calculated as the sum of lines 6, 7, and 11) | 433,431 | 379,966 | 202,450 | 47,063 | 109,914 | 10,277 | 63,728 |